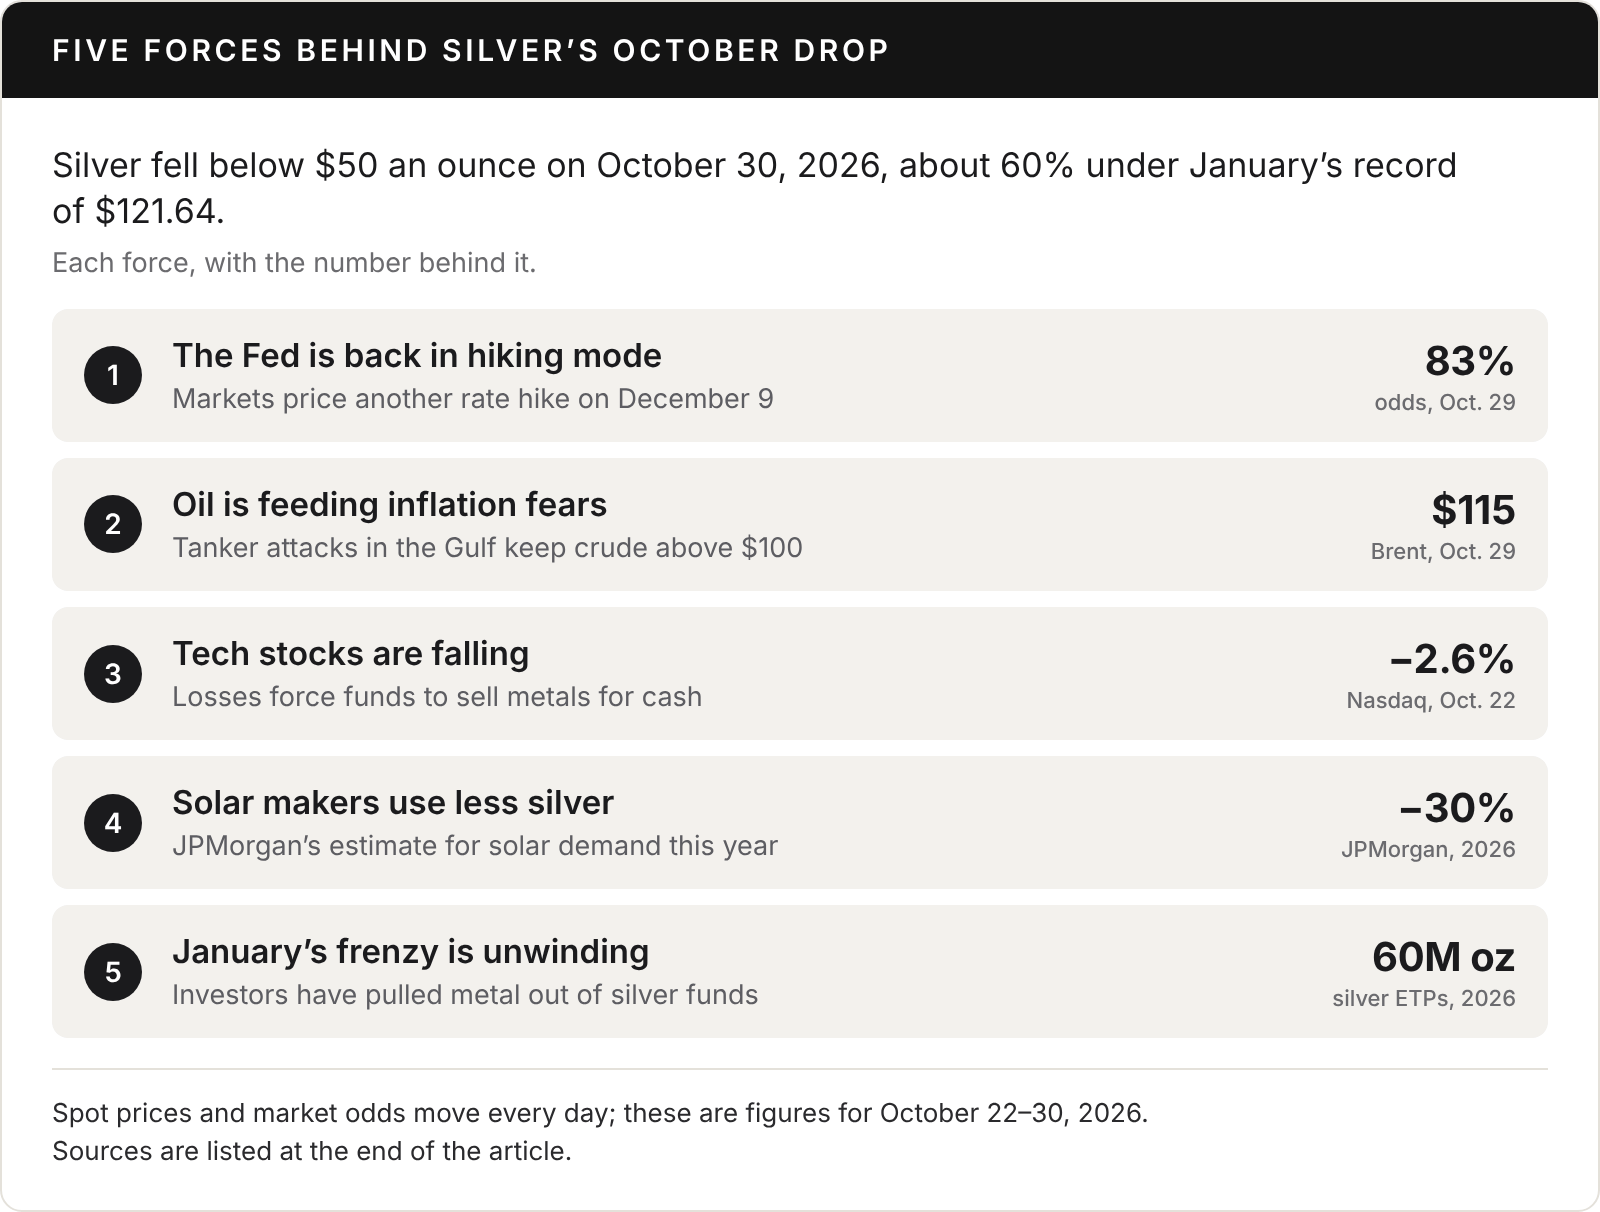
Silver broke below $50 an ounce on October 30, 2026, for the first time since November 2025. By early afternoon in New York it was trading around $49, down more than 5 percent on the day and about 18 percent for October, which leaves it roughly 60 percent below its January record of $121.64. No single headline did it. A Federal Reserve leaning toward another rate hike, oil above $100, a tech-stock selloff, weaker demand from solar makers, and the unwinding of January’s frenzy all landed at once. Here is how each one works, why silver has fallen so much harder than gold, and what the drop means if you are buying silver jewelry.
Key takeaways
- Below $50 for the first time since November 2025. Silver is down about 18 percent in October and roughly 60 percent from January’s $121.64 record.
- The Fed is the biggest weight. After a September hike, futures put about an 83 percent chance on another on December 9, and silver pays no interest.
- Oil and stocks added to it. Brent near $115 keeps inflation sticky, and tech-stock losses pushed funds to sell metals for cash.
- Silver falls harder than gold because central banks don’t buy it and about half its demand comes from industry.
- Jewelry moves far less than the metal. On a 6 mm band, the drop from $120 to $50 silver is worth $12 to $19 of metal; heavy chains feel it most.
In this guide How far The Fed Oil Stocks Solar January Silver vs. gold Jewelry prices What next FAQ
How far silver has fallen
Silver now sits about 60 percent below its January peak, and the latest leg was quick: from $58.60 on October 20, it fell nearly 16 percent in eight trading sessions.
| Date | Silver, per ounce | What happened |
|---|---|---|
| January 29 | Silver, per ounce$121.64 | What happenedAll-time high, after a run of more than 60 percent in January |
| January 30 | Silver, per ounceBelow $75 | What happenedFell more than 30 percent in about 30 hours amid a string of exchange margin hikes |
| October 14 | Silver, per ounce$55.74 | What happenedThe year’s lowest close at that point, after hot US inflation data |
| October 20 | Silver, per ounce$58.60 | What happenedOctober’s high, just before the latest slide began |
| October 29 | Silver, per ounceAbout $52.20 | What happenedDown about 3 percent after strong US growth and inflation figures |
| October 30 | Silver, per ounceAbout $49.20 | What happenedBelow $50 for the first time since November 2025 |
1. The Fed is back in hiking mode
Rising rate expectations are the biggest single weight on silver. The metal pays no interest, so every step up in what cash and bonds pay makes holding it less attractive.
The Federal Reserve raised its target range to 3.75 to 4.00 percent on September 16, its first hike since July 2023. On October 28 it held there, but two of its 12 voters, Governor Lisa Cook and Cleveland Fed President Beth Hammack, wanted another quarter-point increase right away, Admiral Markets reported. The next day, third-quarter GDP came in at a 3.4 percent annual pace, above the 3.2 percent forecast, and core PCE inflation, the Fed’s preferred gauge, rose to 3.1 percent.
By the afternoon of October 29, futures priced about an 83 percent chance of another hike at the December 9 meeting, according to BullionVault. Ten-year Treasury yields actually dipped that day, which usually helps metals, yet silver still fell about 3 percent. As 24/7 Wall St. pointed out, that leaves the Fed outlook itself as the source of the pressure.
2. Oil above $100 is feeding inflation fears
War in the Middle East would usually help precious metals. This time it is hurting silver, because the conflict shows up first in oil prices, and expensive oil keeps inflation sticky.
Attacks on tankers in the Gulf and the Strait of Hormuz have kept crude high all month. Brent topped $110 a barrel on October 21, Khaleej Times reported, and settled near $115 on October 29, according to Kitco. Saxo Bank’s Ole Hansen tied silver’s October 23 slide to the inflationary effect of rising energy costs, Forbes reported.
The chain runs like this: higher oil lifts inflation, inflation raises the odds of Fed hikes, and higher rates weigh on a metal with no yield. Before the conflict began on February 28, markets expected two rate cuts in 2026; by early April they had priced out cuts entirely, according to Trading Economics.
3. A tech-stock selloff is spilling into metals
Losses in one market often force selling in another. The Nasdaq Composite fell 2.6 percent on October 22, according to Tapeboard, and another 1.4 percent on October 29, when Alphabet dropped about 13 percent in a single session, Kitco reported. On October 30, MINING.COM reported that the tech rout was pushing investors to sell metals to cover losses elsewhere, and mining stocks fell as much as 8 percent.
Trend-following funds add fuel. Their models sell as prices break below key levels, and silver was already 25 percent under its 200-day average by October 27, according to 24/7 Wall St. Hansen warned that more selling by these funds could open the way to the mid-$40s.
4. Solar makers are using less silver
Silver is an industrial metal as much as a precious one. On Silver Institute figures, about half of annual demand comes from electronics, solar panels, electric vehicles, and medical uses, as GoldSilver notes, and that side of the market has weakened.
Solar is the biggest swing factor. After silver’s run-up, panel makers moved to thin the silver paste in their cells or switch to other metals. JPMorgan expects solar demand for silver to fall about 30 percent this year, roughly 60 million ounces, and in August it cut its fourth-quarter price forecast from $90 to $63 an ounce.
The Silver Institute still projects a 2026 supply deficit of 46.3 million ounces, the sixth in a row, and already assumes some solar decline. How deep that decline runs could decide whether the deficit happens at all.
5. January’s frenzy is still unwinding
Part of today’s weakness is January’s hangover. Silver gained more than 60 percent that month to its $121.64 record, driven by safe-haven buying and a dollar at four-year lows, on record trading volumes in London and China, ROIC.ai reported.
Exchanges responded by making leverage more expensive. CME Group switched to margins set as a share of a contract’s value on January 13, Bloomberg reported, then raised silver requirements again and again; on February 5 it lifted the initial margin to 18 percent, from 15 percent, according to Tiger Brokers. Silver lost about 32 percent in less than a week, by the count of S&P Global Market Intelligence.
Investors have kept trimming since. Silver exchange-traded products have shed about 60 million ounces this year, FinanceFeeds reports, and the speculative buying that powered January hasn’t come back.
Why silver is falling faster than gold
Gold is down too, but far less. From their October highs, silver had fallen about 16 percent by the morning of October 30, against about 7 percent for gold, according to The Rio Times.
Two differences explain most of the gap. Central banks buy gold as a reserve asset but not silver, so gold has a steady buyer underneath it that silver lacks, as GoldSilver notes. And silver’s industrial role means higher rates hit it twice: once as an asset that pays nothing, and again through worries about factory demand, as GuruFocus put it.
The gold-to-silver ratio, the number of ounces of silver one ounce of gold buys, shows the shift. It reached about 77 on October 29, its highest in 11 months, according to BullionVault, up from about 46 at silver’s January peak (Find Bullion Prices). Our comparison of sterling silver and white gold shows what the gap between the two metals means for a ring.
What the drop means for silver jewelry prices
For most sterling jewelry, the metal is a minority of the price, so a 60 percent drop in silver won’t cut retail prices by 60 percent. Labor, design, finishing, and the seller’s margin make up the rest, and they don’t move with the market. The metal itself is easy to work out: grams × 0.925 ÷ 31.1 × the silver price, as our guide to what sterling silver is worth explains.
| Piece | At $120 an ounce | At $50 an ounce | Difference |
|---|---|---|---|
| 6 mm band, size 10, 6–9 g | At $120 an ounce$21–$32 | At $50 an ounce$9–$13 | Difference$12–$19 |
| 6–7 mm bracelet, 8.5″, 18–28 g | At $120 an ounce$64–$100 | At $50 an ounce$27–$42 | Difference$37–$58 |
| 5 mm curb chain, 22″, 30–50 g | At $120 an ounce$107–$178 | At $50 an ounce$45–$74 | Difference$62–$104 |
| 8–9 mm Cuban chain, 22″, 77–117 g | At $120 an ounce$275–$418 | At $50 an ounce$114–$174 | Difference$161–$244 |
- Heavy, plain pieces move most. Chains, cuffs, and solid link bracelets carry the most metal, so that is where lower silver prices can show up first.
- Expect a lag. Sellers price from stock bought earlier in the year, so tags tend to trail the metal by weeks or months. One independent maker that raised prices in February has said it will lower them if silver falls significantly (Christy Robinson Design).
- Check the price per gram. Divide a heavy piece’s price by its weight and compare sellers. Whatever sits above the metal pays for the making, the finish, and the brand; our Black Friday checklist shows how to spot a price that doesn’t add up.
- Read the material line. As silver got expensive, some brands moved styles to plated alloys; Pandora said in February it would cut silver to about a quarter of its range, Capital FM reported. Look for “925” or “sterling silver,” not “silver-tone.”
- Don’t time the metal on small pieces. On a 6 mm band, the whole swing from $120 to $50 silver is worth $12 to $19. Fit and build quality matter far more.
What to watch next
Silver’s next move depends mostly on the Fed and on oil, and neither is settled.
- The December 9 Fed meeting. A turn would likely need silver to hold $50 and the odds of a December hike to fall well below 75 percent, 24/7 Wall St. argues; they were about 83 percent on October 29.
- The $50 level. Saxo’s Hansen sees the mid-$40s in play if fund selling continues.
- Oil and the Middle East. Cheaper crude would ease the inflation pressure behind rate-hike bets.
- The gold-to-silver ratio. A falling ratio would be an early sign that silver’s relative weakness has run its course, as GuruFocus notes.
FAQ
Why is silver dropping right now?
Mainly because markets expect the Fed to raise rates again on December 9, which makes a metal that pays no interest less attractive. Oil above $100 keeps inflation sticky, losses in tech stocks have pushed funds to sell metals, solar makers are using less silver, and January’s speculative rally is still unwinding.
How low has silver gone?
It fell below $50 an ounce on October 30, 2026, for the first time since November 2025, and traded around $49 in the early afternoon in New York. That is roughly 60 percent below the record of $121.64 set on January 29.
Why is silver falling more than gold?
Central banks buy gold as a reserve asset but not silver, and about half of silver’s demand is industrial, so rate hikes and a weaker economy hit it harder. The gold-to-silver ratio reached about 77 on October 29, its highest in 11 months.
Will silver jewelry get cheaper?
Some of it, slowly. The metal is a minority of the price of most pieces, and sellers price from stock bought earlier, so expect heavy, plain chains and cuffs to move first and small rings to barely change.
Is now a good time to buy silver jewelry?
If you are buying a piece to wear, the piece matters more than the metal price: on a 6 mm band, the whole drop since January is worth $12 to $19 of silver. On a heavy chain, compare the price per gram across sellers. This is not investment advice.
Is it a bad time to sell silver jewelry for scrap?
Melt value is about 60 percent lower than at January’s peak, so a piece sold by weight brings far less than it would have then. Our guide to what sterling silver is worth shows how to work out a fair offer.
Bottom line
Silver’s October drop is a story about interest rates more than about silver itself: the Fed is leaning toward another hike, oil is keeping inflation high, and stock losses and weaker solar demand piled on. For jewelry buyers, the effect is smaller than the headlines suggest. A band holds only a few dollars of silver either way, while heavy chains carry enough metal for the drop to matter, so that is where to compare prices per gram.



From the collection
Men’s sterling silver chains by Ronatelli
Ten handmade 925 chains, from a 2 mm snake chain to a 7 mm curb, in 20 to 26 inches. Every length is the same price.
Related guides
This article explains market moves for jewelry buyers; it is not financial or investment advice. Silver prices are spot quotes reported by MINING.COM, Kitco, BullionVault, and Trading Economics on October 29 and 30, 2026, and the January record and crash follow 24/7 Wall St.; prices change all through the day. The Fed decision follows Admiral Markets, and the December rate odds BullionVault’s report of CME FedWatch. Solar demand and the JPMorgan forecast follow GoldSilver’s summary of JPMorgan and the Silver Institute, and oil prices follow Khaleej Times and Kitco. Piece weights are the typical solid-sterling ranges from our ring, chain, bracelet, and Cuban chain guides. All were checked on October 30, 2026. Read our editorial policy.

